RNASeq Differential Expression Analysis
How to read Differential Expression Analysis interface?
This page allows to display and interpret the difference in expression level of genes for two (or more) experimental conditions and highlights those for which this difference is statistically significant. Results can be obtained by following 6 steps, described below:
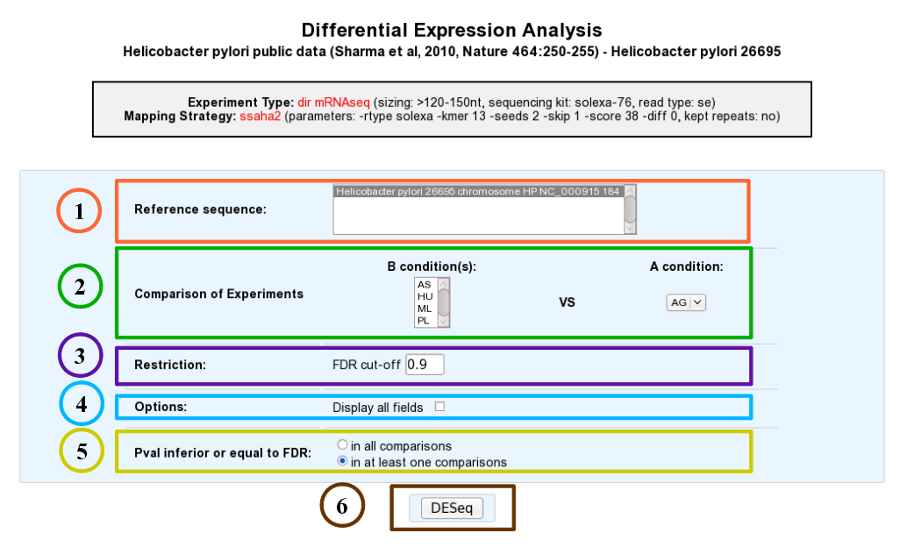
1. Choose one or several reference sequences.
2. Select at least one B condition to compare to A condition (which will be used as reference).
3. The p-value adjusted (padj) column contains the p-values, adjusted for multiple testing with the Benjamini-Hochberg procedure (see the standard R function p.adjust), which controls false discovery rate (FDR) . It’s possible to restrict the result for the ones which are under a fixed FDR cut-off. Example : A FDR adjusted p-value (or q-value) of 0.05 implies that 5% of significant tests will result in false positives.
4. Choose to have all the fields of the result table or a light version. The fields will be fully described in the next section.
5. If several B conditions are chosen, the fixed FDR cut-off can be fixed in all comparisons or in at least one comparisons for each gene.
6. Submit query.
How to read the table of results?
Case 1 : One B condition selected.
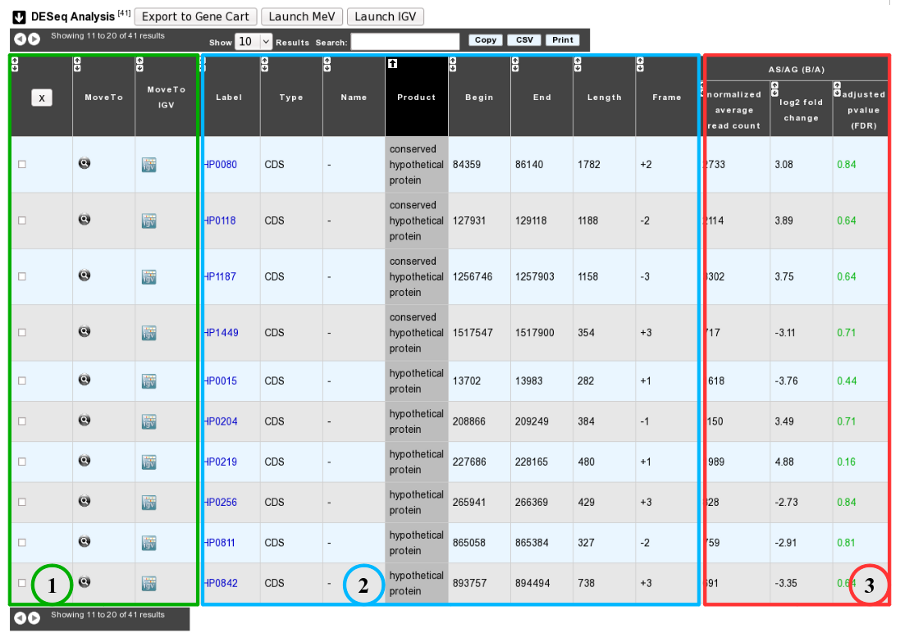
1. Export functions. This section allows users to make all genes (or subsets of genes) available for other analysis tools. 3 main operations are possible here:
select subsets of genes (by selecting checkboxes on the first column) and export them into a Gene Cart by using the “Export To Gene Cart” button.
See one selected gene into the MaGe Genome Browser by clicking on the magnifying glass.
Direct link to the selected gene in Integrative Genome Viewer.
2. The second part reports the main genomic object features : Label (Link to more Genomic Object information), Type, Name, Product, Begin, End, Length, Frame.
3.
Light Result part: Normalized average read count, log2foldchange, adjusted p-value, FDR (all the result are under the chosen value)
DESeq Module Result part:
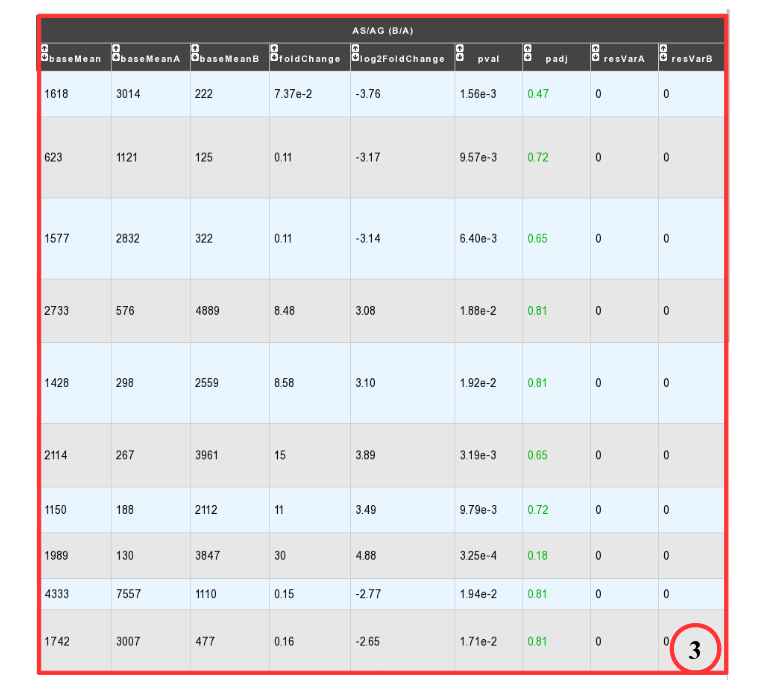
baseMean = normalized average read count.
baseMeanA = normalized average read count for condition A.
baseMeanB = normalized average read count for condition B.
foldChange .
log2foldchange.
p-value = non adjusted pvalue.
padj = adjusted p-value, FDR (all the result are under the chosen value)
resVarA et resVarB = These columns contain the ratio of the variance as estimated from the counts for just this gene over the -* variance as predicted from the mean.
All these results are fully described in : http://bioconductor.org/packages/2.6/bioc/vignettes/DESeq/inst/doc/DESeq.pdf
Case 2 : Two B conditions or more selected.
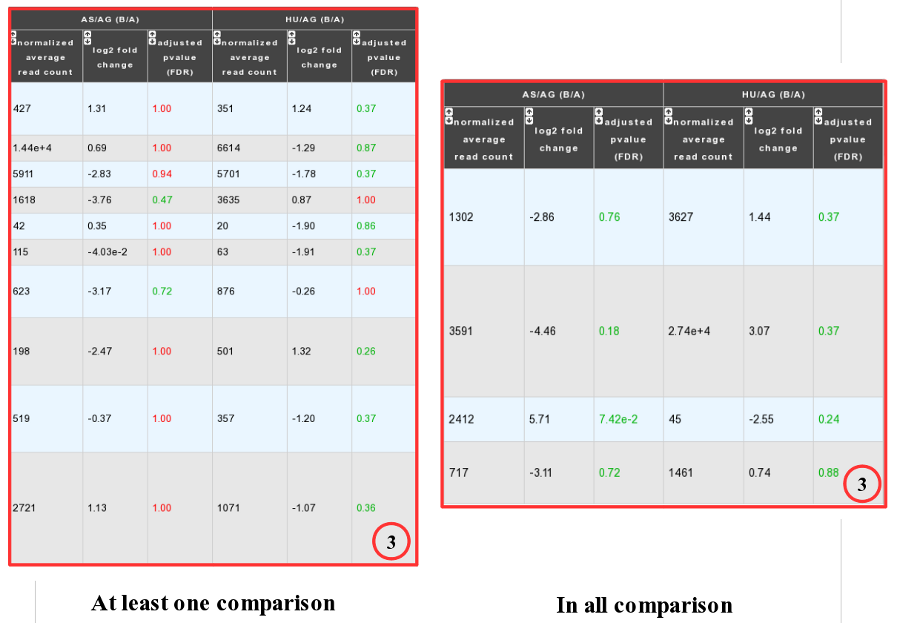
Users can choose to see the union or intersection result.