AntiSMASH cluster visualization
What is antiSMASH?
Reference:
How can I visualize the clusters predicted by antiSMASH?
You can access to the antiSMASH cluster visualization window by clicking on the number indicated in the antiSMASH Region ID field in the antiSMASH result table.
This window allows you to visualize the antiSMASH cluster predictions and their genomic context.
You can also use the main navigation menu in the Metabolism section and Secondary Metabolites subsection to obtain the antiSMASH predictions page. This page enumerates all secondary metabolite clusters detected for the selected organism and its replicons.
What information are in this window?

Item #1: Viewer
Item #2: Region description section
Item #3: ‘Knownclusters’ section
Item #4: ‘Genomic Objects’ section
Item #5: ‘Clusters’ section
All the elements are more described below.
Viewer
The Viewer allows you to visualize a selected antiSMASH cluster prediction and its genomic context.
The representation is similar to that of MicroScope Genome Browser with the different genomic objects in the region displayed over the 6 reading phases (item #1).
Only some type of genomic object are represented: CDS, fCDS, tRNA, rRNA, misc_RNA, ncRNA, tmRNA, misc_feature and mobile_element.
misc_feature object will appear at the bottom of the viewer.
The colored boxes (item #2) on the blue line in the middle of the Viewer represent the predicted domains of the secondary metabolite genes.
The boxes at the bottom of the viewer display firstly protoclusters (item #3), with their core (item #4) and neighborhoods (item #5), and secondly candidate clusters (item #6) found in this region.

All the boxes can be mouse over to obtain summarized informations about them:
for all boxes, informations about the location and the length of the element are displayed.
for domains boxes, the type and the predicted substrate (if there is one) of the domain and different metrics computed by antiSMASH (score, E-value) are displayed.
for genomic objects boxes, there is information on annotation, gene name, product and type of the genomic object.
for protoclusters and core-protoclusters boxes, the type of the protocluster.
for candidate clusters boxes, the type and the peptide polymer composition (if any) of the candidate cluster.
Data on genomic objects, data on proto-clusters and data on candidate clusters are also described respectively in the following tables Genomic Objects, Proto-clusters and Candidate-clusters.
The color code of the different types of boxes is described in the viewer caption (item #7) and below in the documentation.
Region section

This section present a brief summary of the region, with its identifier, its annotation/type and its location and length.
In case of NRPS/PKS cluster type, the predicted peptide polymer composition may be indicated as well.
If this composition is specific enough, the SMILES prediction and its visualization are displayed.
Thanks to simolecule for Picture’s displays.
Knownclusters section
These tables provide information about similar known clusters described in MIBiG database. The Minimum Information about a Biosynthetic Gene cluster (MIBiG) can help to know more on biosynthetic gene clusters, their molecular products and their related publications.
MIBiG Region Similarities table
This table helps to know more on biosynthetic gene clusters by comparison with MIBiG reference database on all the region.

MIBiG and Locus: Identifier and locus of the MIBiG hit corresponding to the region. Click on the identifier to open the corresponding MIBiG website page.
Product and Type: Product and type of the MIBiG compound.
Completion: Completion of the hit between MIBiG region and antiSMASH predicted region (see below for more information about its computation).
The MIBiG Protocluster Similarities table
This table helps to know more on biosynthetic gene clusters by comparison with MIBiG reference database on the considered protocluster.
This is useful when there is several protocluster in the same region to try to characterize each protocluster.
See below to know more about protocluster.

Protocluster id: Protocluster identifier.
MIBiG and Locus: Identifier and locus of the MIBiG region which hit on the protocluster. Click on it to open the MIBiG website page related to this MIBiG.
Product and Type: Product and type of the MIBiG compound.
Completion: Completion of the hit between MIBiG region and antiSMASH predicted protocluster (see below for more information about its computation).
Genomic Objects section
Genomic Objects Table
This table provides informations regarding the genomic objects depicted in the graphical representation.
Almost all fields are the same than those present in the Genomic Objects table of the Genome Browser (accessible in the MaGe section of the main navigation menu). To known more, see the documentation page of the Genome Browser.

Label: Label of the genomic object.
Begin, End and Frame: Location of the genomic object on the sequence.
Gene: Gene name if any.
Evidence: automatic/validated
Type: CDS, fCDS, tRNA, rRNA, misc_RNA, ncRNA, tmRNA, misc_feature, mobile_element.
Product: Description of the gene product of the genomic object.
antiSMASH annotation: Display notably (if any) the predicted domains and SMCOG (Secondary Metabolite Clusters of Orthologous Groups) class.
Status: Genomic object status predicted by antiSMASH if any. It can be: biosynthetic, biosynthetic-additional, regulatory, transport, resistance, other.
Domain type: Type of the genomic object’s domains predicted by antiSMASH if any.
Status biosynthetic means that the considered gene is a major part or the core of the secondary metabolite system.
Status biosynthetic-additional means that the considered gene is part of the secondary metabolite system.
Tailoring Clusters Similarities table
This table provides informations about genes which may be involved in tailoring reactions.

Tailoring Cluster label, Natural product, Tailoring Cluster product class, PubMedId and Completion help to known more about predicted tailoring clusters.
Label gives the MicroScope gene label.
Tailoring Cluster protein id, Tailoring Cluster gene name and Protein description give characteristics about genes which compose the tailoring cluster.
% identity, Coverage and Evalue give some mathematical indicators about the match between tailoring gene and MicroScope gene.
Clusters section
Protoclusters table
A protocluster is a cluster which contains a core with its neighbourhoods and has only one single product type.

Candidate id: Identifier of the candidate in which the protocluster is found.
Protocluster id: Identifier of the protocluster.
Begin and End: Location of the protocluster on the sequence.
Category: Category of the protocluster’s product.
Type: Product of the protocluster.
Core begin and Core end: Location of the protocluster core on the sequence.
Candidate-clusters table
A candidate cluster contains one or more protoclusters. It is useful for modelisation of hybrid regions, i.e. regions which produce two or more product types.

Candidate id: Identifier of the candidate cluster.
Begin and End: Location of the candidate cluster on the sequence.
Kind: Kind of the candidate cluster. It can be: single, neighbouring, chemical-hybrid, interleaved. See the antiSMASH documentation to known more about the several types of candidate cluster.
Peptide polymer composition: Composition of the predicted peptide polymer in case of NRPS/PKS cluster type, if any.
SMILE: Smile prediction of the peptide polymer if the composition is specific enough.
MIBiG completion
The completion is computed as follow :
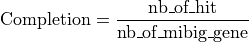
Where:
= number of genes with blast hit in the antiSMASH predicted region and MIBiG region
= number of all genes in the MIBiG curated region
What is the meaning of the color code in the antiSMASH cluster visualisation window?
Color code of the features

Color code of the predicted domains
