AntiSMASH cluster visualization
How can I visualize the clusters predicted by antiSMASH?
You can access to the AntiSMASH cluster visualization window by clicking on the number indicated in the Cluster field in the antiSMASH result table.
You can also use the main navigation menu in the Metabolism section to obtain the AntiSMASH predictions page. This page enumerates all secondary metabolite clusters detected for the selected organism and its replicons.
What information are in this window?
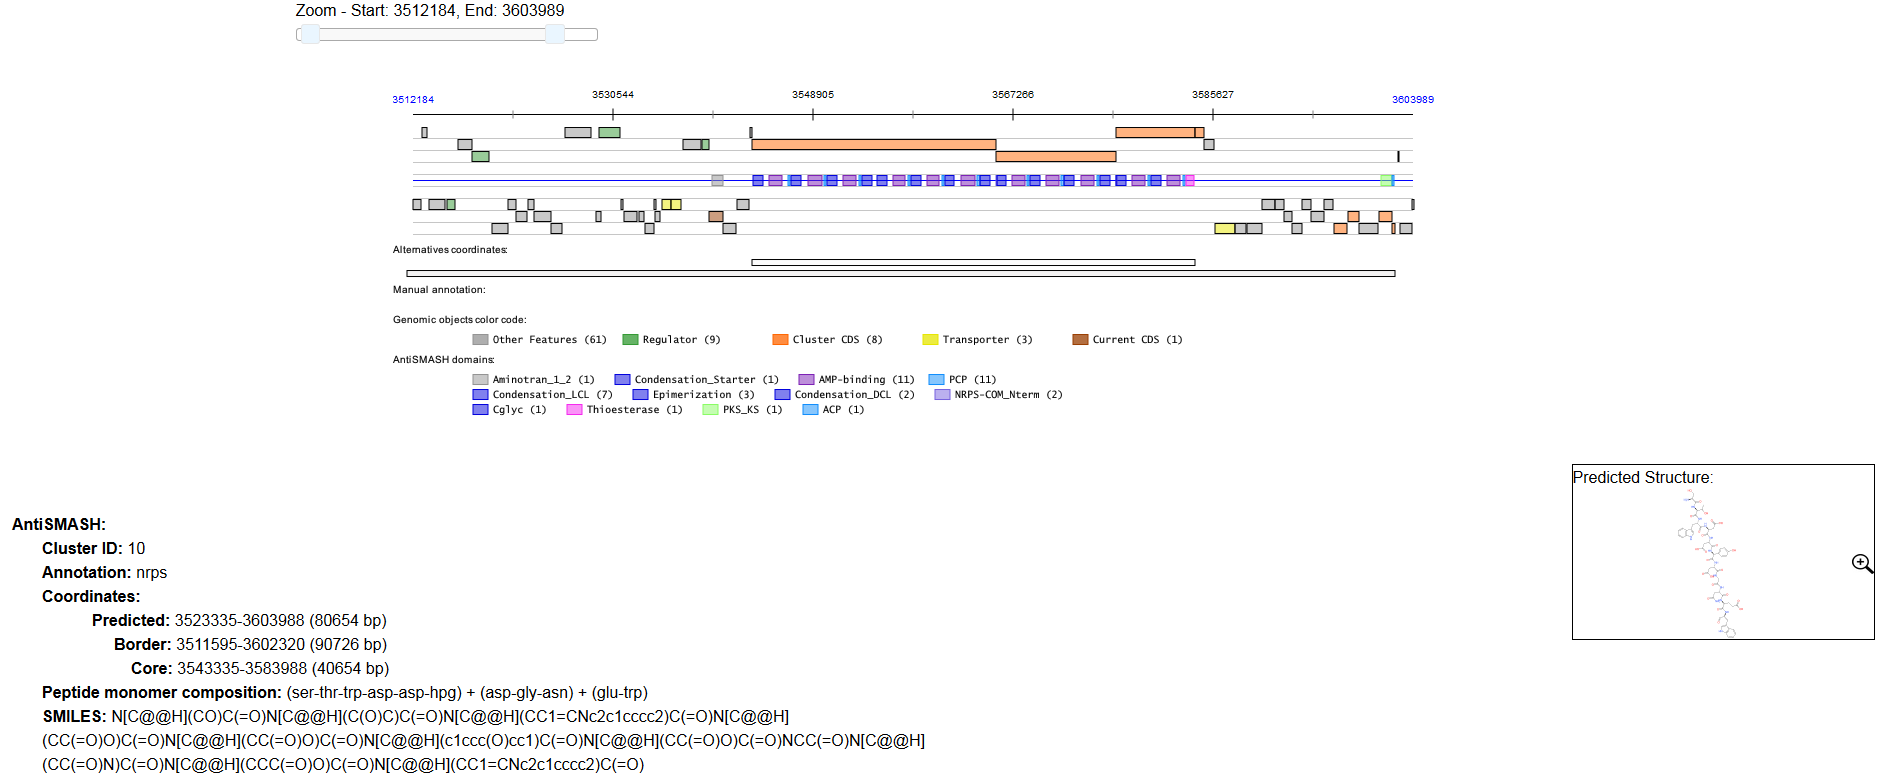
This window allows you to visualize the antiSMASH cluster predictions and its genomic context.
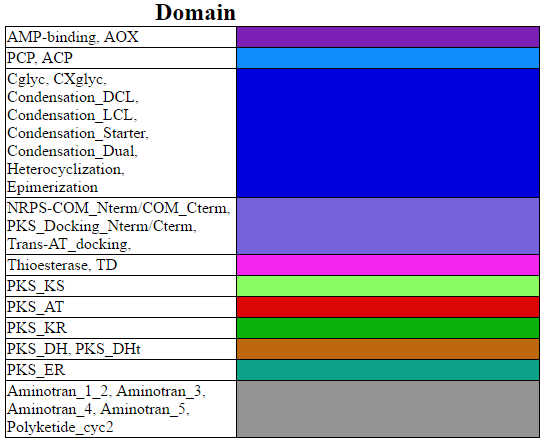
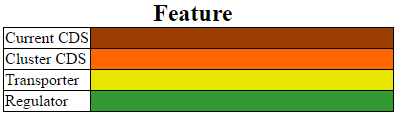
The boxes in the middle of the viewer (on the blue line) represent the predicted domains of the predicted secondary metabolite genes. The other boxes in the viewer represent the genomic object existing in the region. Only some type of genomic object are represented (‘CDS’,’fCDS’,’tRNA’,’rRNA’,’misc_RNA’,’ncRNA’,’tmRNA’,’misc_feature’,’mobile_element’). ‘misc_feature’ object will appear at the bottom of the viewer.
All the boxes in the viewer can be mouse over to obtain summarized informations about them. The genomic object data are also described in the Genomic Objects table below.
In case of NRPS/PKS cluster type, the predicted peptide monomer composition may be indicated as well, if this composition is specific enough, the smile prediction and its visualization are displayed.
Cluster Prediction: classical antiSMASH prediction, it corresponds to the Cluster core coordinates with an extension.
Cluster Border: Improved prediction of gene cluster boundaries using ClusterFinder algorithm These estimations are based on frequencies of locally encoded protein domains detected by Pfam (based on these being either more or less BGC-like).
Cluster Core: cluster coordinates correspond to the “main” genes used for characterization of secondary metabolite.
Thanks to simolecule for Picture’s displays.
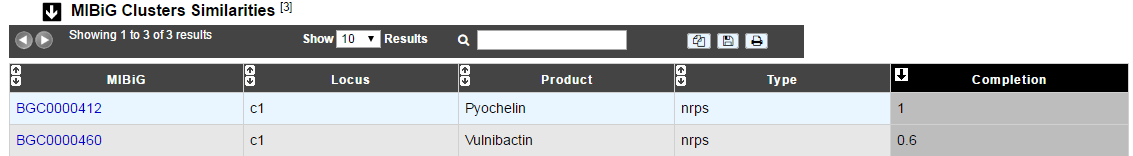
The MIBiG Clusters Similarities table provides information about similar known clusters described in MIBiG database. The Minimum Information about a Biosynthetic Gene cluster (MIBiG) can help to know more on biosynthetic gene clusters, their molecular products and their related publications.
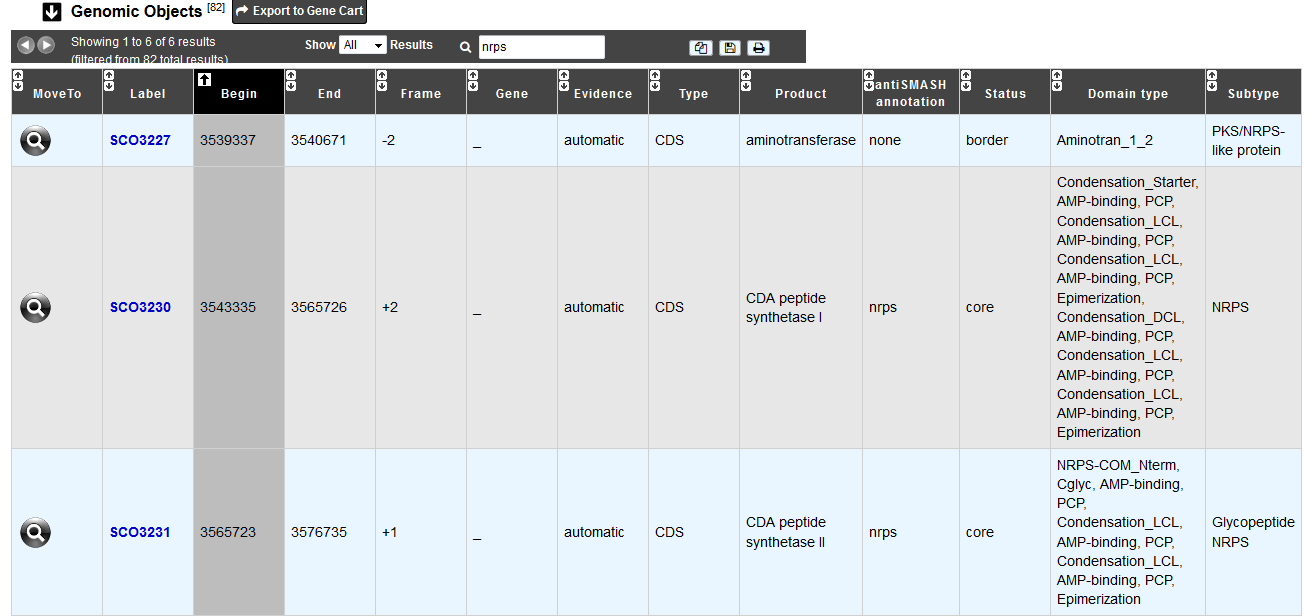
The Genomic Objects table provides information regarding the genomic objects depicted in the graphical representation.
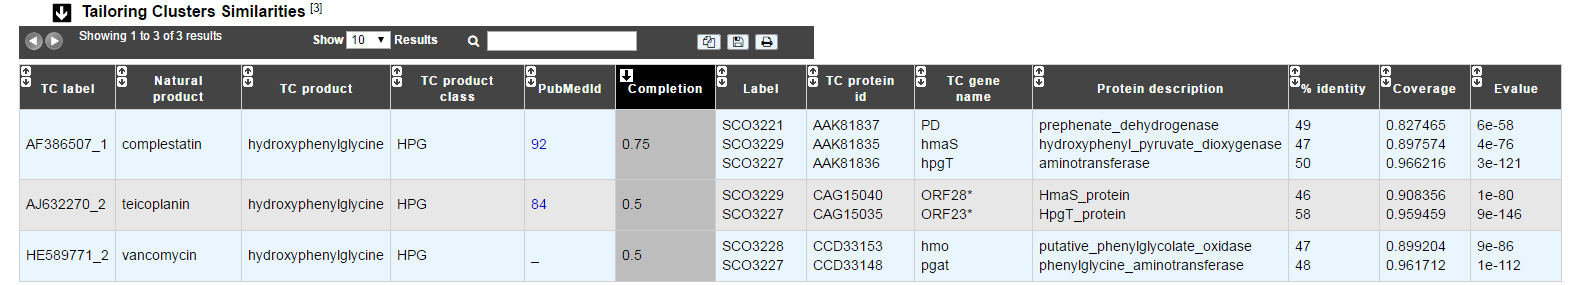
The Tailoring Clusters Similarities table provides information about genes which may be involved in tailoring reactions. By clicking on the number, you can access to the Pubmed related publication.
- The 6 first columns help to know more about the predict tailoring clusters.
- Label column gives the MicroScope gene label.
- TC protein id , TC gene name and Protein description give information about genes which compose the tailoring cluster.
- % identity, Coverage and e-values give some mathematical information about the match between tailoring gene and MicroScope one.